Six months ago I launched OppenFolio with a simple goal:
Take $50K of capital, scale it up in $10K tranches, and build a machine that spits out $1K a month in after-tax income.
Today? That’s exactly what it’s doing.
Which feels… strange.
The Numbers
- Portfolio scaled to $50,000, right on plan
- Current cash flow: ~$1,000/month after tax
- Paper NAV: –2% unrealized
- Dividends earned: +4%
- Net effect: +2% new money overall
That’s the machine, working as designed.
No drama. No fireworks. Just steady output.
So why does it feel like something’s off?
The Invisible Downforce
Because NAV decay is real. And it’s nastier than I gave it credit for.
Here’s the math as I see it now:
- YieldMax ETFs don’t act like normal stocks. They’re synthetic covered calls, so they don’t ride up with the market.
- Instead, they carry a built-in –1% monthly downforce. Like rust. Constant, slow, unavoidable.
- The portfolio has dragged about –2% over six months from that pressure.
- Dividends brought in +4%, or about +3% after tax.
- Which means our real after-tax gain is closer to +1%.
The machine works. But it’s fighting gravity every step of the way.
Without adjustments, we’re not beating the market. At best, we’re floating.
Shifting the Lens
That realization made me start looking at OppenFolio differently.
Instead of one giant machine with a shell and a core, I started breaking it down by contribution per symbol.
Not just what is this ticker worth today? but what has this ticker actually done for us in net terms?
Here’s the chart I built:
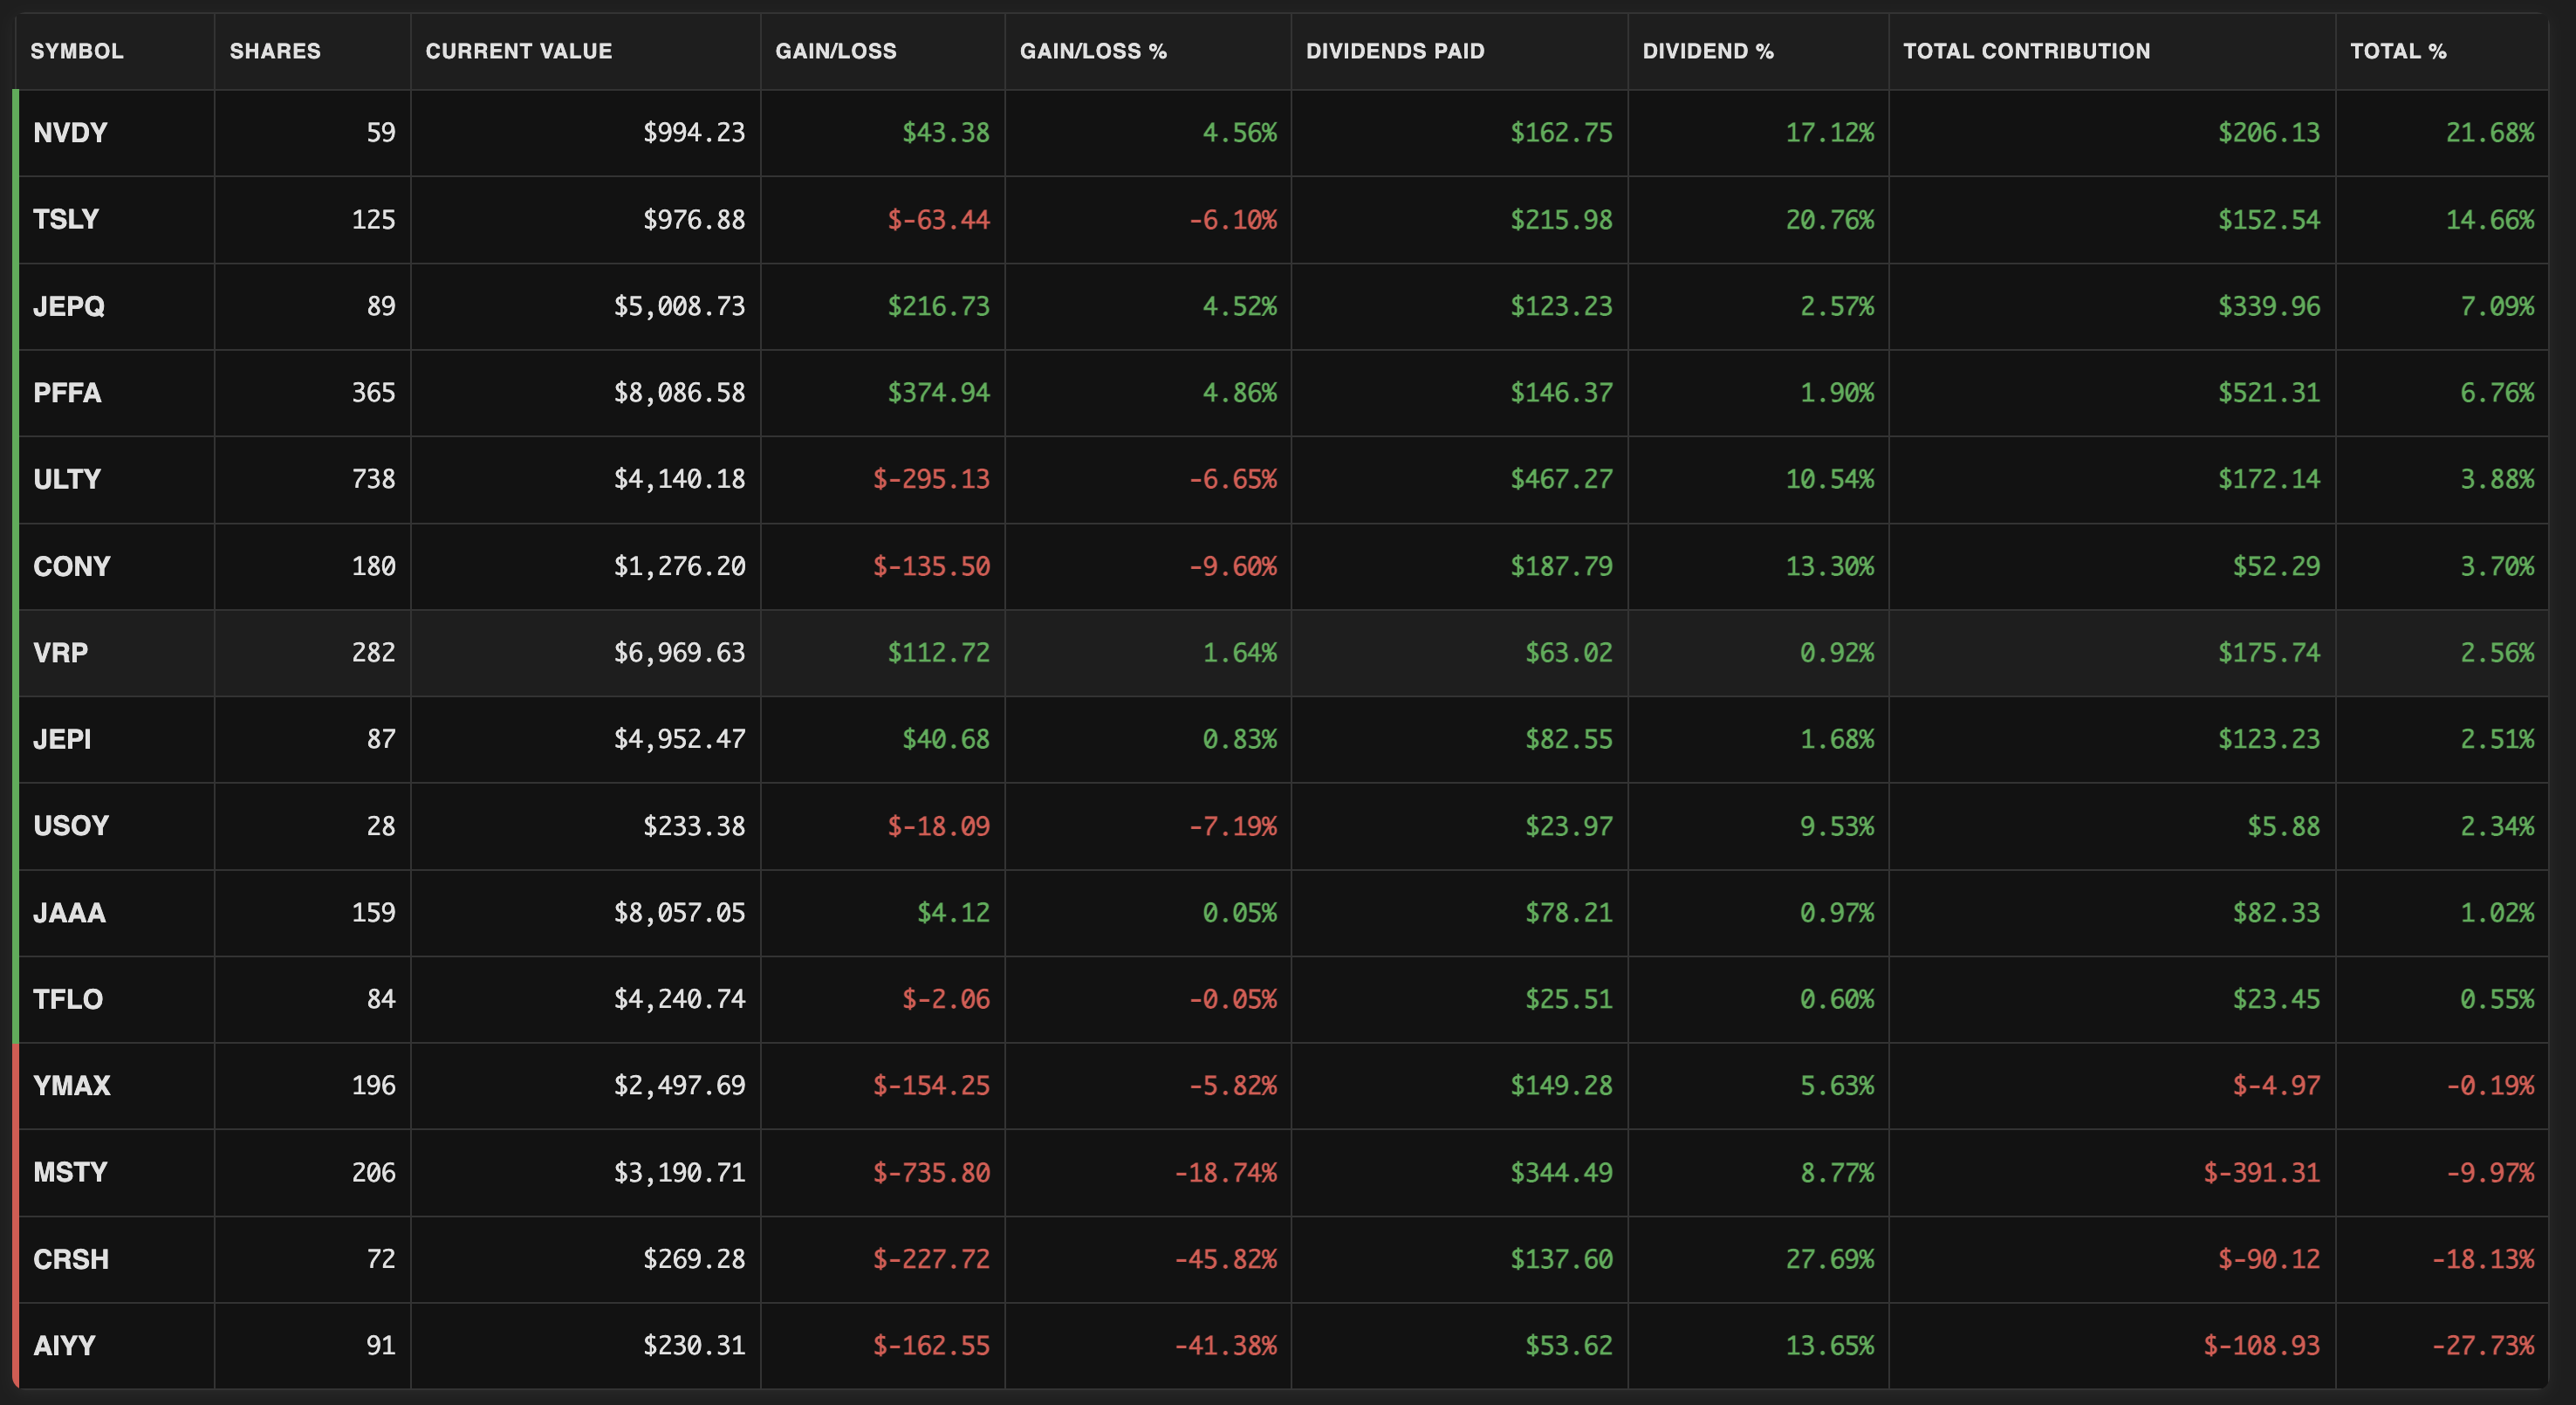
Some takeaways:
- MSTY is down about $800, but dividends clawed back $400. Net: –$400. Manageable.
- NVDY is up on price and paying dividends. Net: positive.
- CRSH and AIYY? Outliers. Heavy negative contributors. They don’t just sag, they sink.
When you sort the data this way, the portfolio naturally splits:
A cluster of “not great, but fine” names… and then the couple of anchors dragging everything down.
That gap made one decision easy:
I stopped buying CRSH and AIYY. I’m looking to sell them outright.
The Next Evolution
So where does OppenFolio go from here?
The design is shifting from rigid allocation (core vs. shell) to dynamic optimization.
- Symbols that consistently contribute? Scale them up.
- Symbols that consistently subtract? Scale them down, or cut them entirely.
- Let the portfolio teach itself what mix works best over time.
In other words: stop treating the structure as sacred. Start treating it as adaptive.
The Weirdest Part
The weirdest part isn’t that OppenFolio is “only” making 1%.
It’s that it’s doing exactly what I built it to do.
That’s both reassuring and unsettling.
Because if the system is working, and the system still fights drag this hard… then the next version has to be smarter, faster, more selective.
OppenFolio 1.0 proved the machine works.
OppenFolio 2.0 will prove it can evolve.
You can always reach me at [email protected] if you want to go deeper.
Disclaimer: This post is for informational purposes only and reflects personal opinions, not financial advice. OppenFolio is not an investment advisory service. See site disclaimer for full details.